
On a familiar Mercator world map, Greenland can look comparable in size to Africa. Their actual areas are about 2.17 million and 30.4 million square kilometres respectively. Africa is roughly fourteen times larger. Nothing about Greenland itself explains the apparent change; its position far from the equator puts it in a part of the map where area is greatly exaggerated. 3
This is more than a mistake in a particular drawing. Every flat world map changes some geometric property of the surface it represents. A map can preserve relative areas or keep angles accurate locally, for example, but it cannot preserve every distance, direction, area and shape across the whole Earth. Cartographers choose which properties matter for the job. 1
Putting a curved surface on paper
Latitude and longitude describe positions on a model of Earth. A projection converts those positions into coordinates on a flat surface. It is a mathematical rule, not necessarily an image produced by shining a light through a globe. Surveying commonly uses an ellipsoid, a slightly flattened model of Earth, rather than a perfect sphere. Australia’s national mapping grid, for example, projects coordinates from an ellipsoid. 5
The difficulty is easy to see with a globe’s grid. Meridians meet at the poles, while parallels of latitude become smaller towards them. A rectangular arrangement of evenly spaced vertical and horizontal lines cannot keep all those relationships intact. Different projection formulas distribute the resulting distortion differently. 4
What Mercator was designed to preserve
The standard Mercator projection is conformal: it preserves angles at a point, so sufficiently small features retain their local shape. It also makes a route with a constant bearing relative to true north appear as a straight line. Those properties explain its navigational use. A sailor following such a line can maintain a fixed true bearing, although the route will generally not be the shortest one between the two places. 2
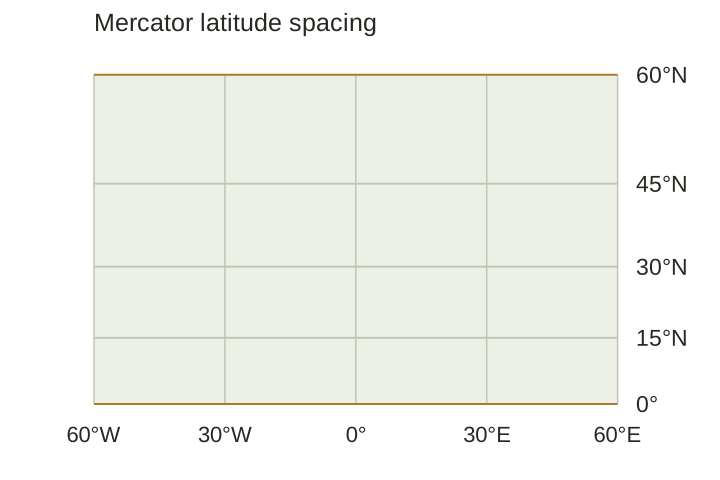
On this projection, meridians are parallel vertical lines instead of meeting at the poles. Parallels become increasingly separated at high latitudes. The stretching becomes extreme towards either pole, and the poles themselves cannot appear at a finite position on the map. The same construction that is useful for bearings is therefore unsuitable for judging the relative areas of continents. Preserving local angles does not mean that the overall outline of an enormous landmass is unchanged. 2
Why relative size matters
The Greenland comparison is striking because it changes a familiar visual judgement. A reader usually has no independent area measurement in mind when looking at a continent. The size of the shape on the page becomes the evidence. On a Mercator map, the same country would occupy a different apparent area if moved to another latitude, even though its real area had stayed constant. 3
That becomes a practical problem when a map shows environmental data. Imagine two regions with the same actual area affected by drought. If one is enlarged by the projection, it can dominate the picture despite covering no more ground. An equal-area projection preserves the relative area of the regions, making it a more appropriate basis for that comparison. It still changes angles and shapes; equal-area describes a specific property, not a guarantee that everything on the map is accurate. 4
A border map, a navigation chart and a map of forest loss can therefore need different projections. Even a map labelled “equidistant” needs care: the true distances are preserved from particular points or along particular lines, not between every possible pair of locations. Measuring arbitrary routes with a ruler can give a misleading result. 1
Why a local map can work very well
The distortion on a world map need not make a street map or survey plan unusable. A projection can be arranged to keep errors small over a limited region. Transverse Mercator, for instance, is useful for areas that extend a long way north to south, but its distortion increases as you move away from its central meridian. 5
The Universal Transverse Mercator system uses sixty longitudinal zones, normally six degrees wide. Each zone has its own central meridian. The Map Grid of Australia 2020 uses this system with the GDA2020 reference frame. Instead of asking one flat map to represent the entire Earth equally well, it gives each relatively narrow strip a suitable coordinate grid. 5
Projection is only one decision
Rotating a map so south is at the top does not, by itself, change the relative areas of the shapes already on it. Nor does putting a different country in the middle automatically make a map equal-area. Orientation and page layout are separate from the geometric property a projection preserves. A different projection or a different set of projection parameters may be needed to change the distortion. 4
These choices affect how a map is read. A useful description says what the map is meant to show and names the projection where it matters. For a map of area comparisons, the important question is whether relative areas survive the transformation. For a local plan, it may be how much the scale varies within the area of interest. A familiar-looking world outline is not enough to answer either question. 1
Sources
- U.S. Geological Survey — How are different map projections used? (opens in a new tab)
- Esri ArcGIS Pro documentation — Mercator (opens in a new tab)
- European Union Data Visualisation Guide — Map projections (opens in a new tab)
- Esri — Choose the right projection (opens in a new tab)
- Geoscience Australia — Map Grid of Australia 2020 (opens in a new tab)